EdgeConnect Telemetry API Demo
Important
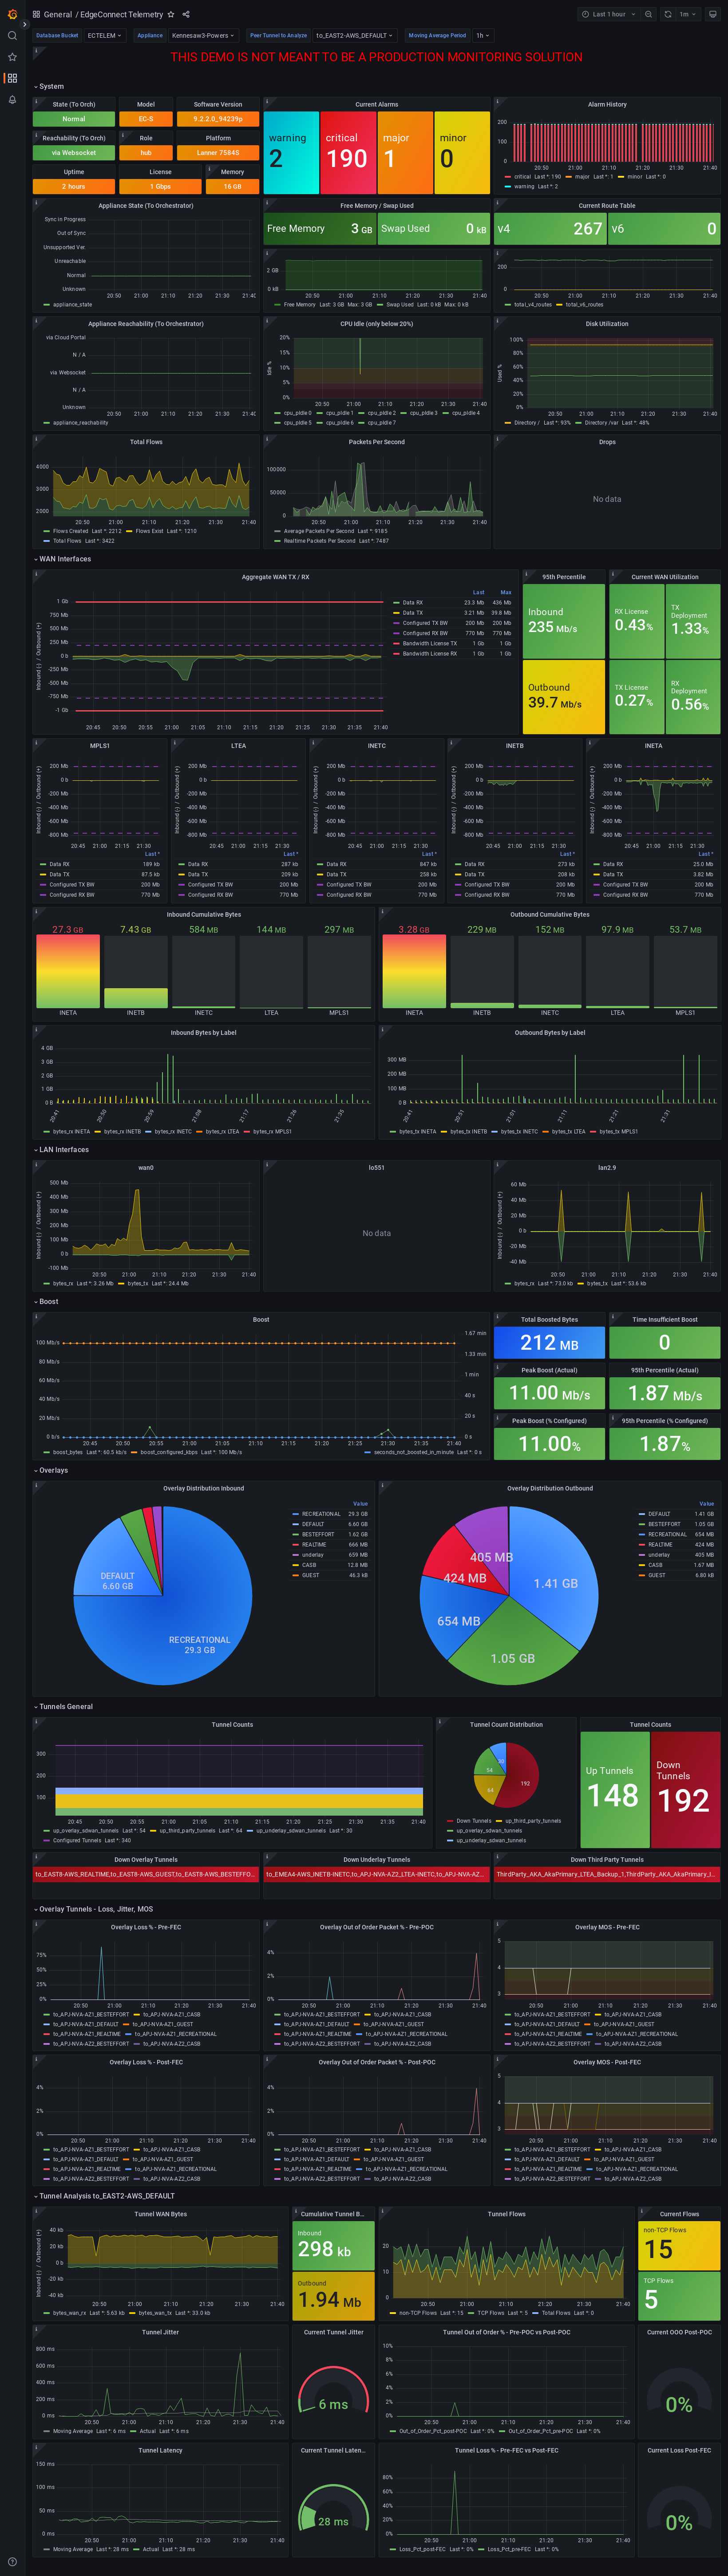
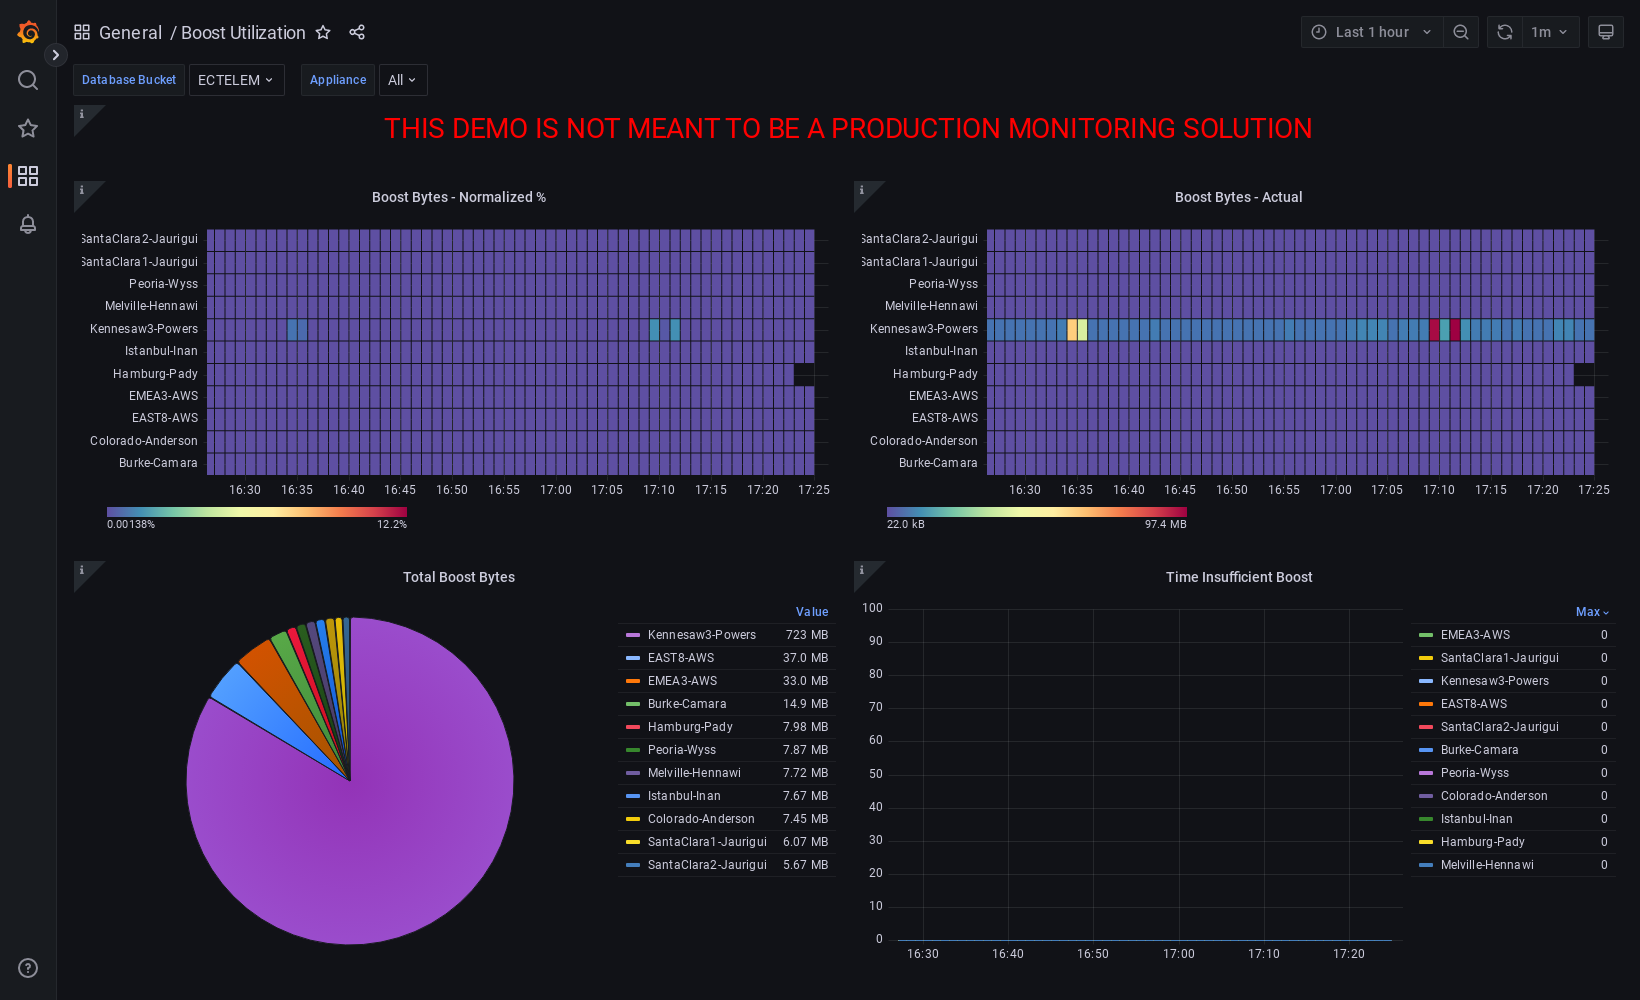
THIS DEMO IS NOT MEANT TO BE A PRODUCTION MONITORING SOLUTION
This example code serves to demonstrate the possibilities in retrieving telemetry data from Orchestrator and EdgeConnect and visuzalize it. The demo is simple to run, however, modifying and/or incorporating components of this work into your own solution requires a greater understanding of Python, Docker, InfluxDB, Grafana, and Redis.
All of these components are not necessarily required for developing your own solution as there may be pieces of data you don’t need to collect, some additional others that you want to add, substitude alternative tools for task queuing, database, and visualization or alerting needs.
Note
The code referenced in this document and all published examples with pyedgeconnect are available from the GitHub repository within the examples folder. Each example script contains logic to authenticate to the Orchestrator as documented in the authentication example.
Clone the repository and download the examples with:
$ git clone https://github.com/SPOpenSource/edgeconnect-python.git
Overview and System Prerequisites
This example code is meant to launch an external telemetry collection and visualization demonstration for EdgeConnect SDWAN appliances.
A user can run this demo on any host system with Docker containers and point it towards an Orchestrator instance for EdgeConnect SDWAN and instantly begin visualizing many different pieces of data from discovered appliances. Knowledge of the underlying systems, Python, or other open-source software solutions leveraged in this demo is required.
For those looking for examples on how to collect this data, all of the Python scripts used in the ec-telemetry and ec-telemetry-worker containers can be reviewed and all the API endpoints used to collect the data in the demo are documented in this overview.
If you want to get right to running it, jump to Required Configuration To Run Demo
To skip to example screenshots and dashboard overviews, jump to Dashboards
Note
- References for open-source tools used in this demo:
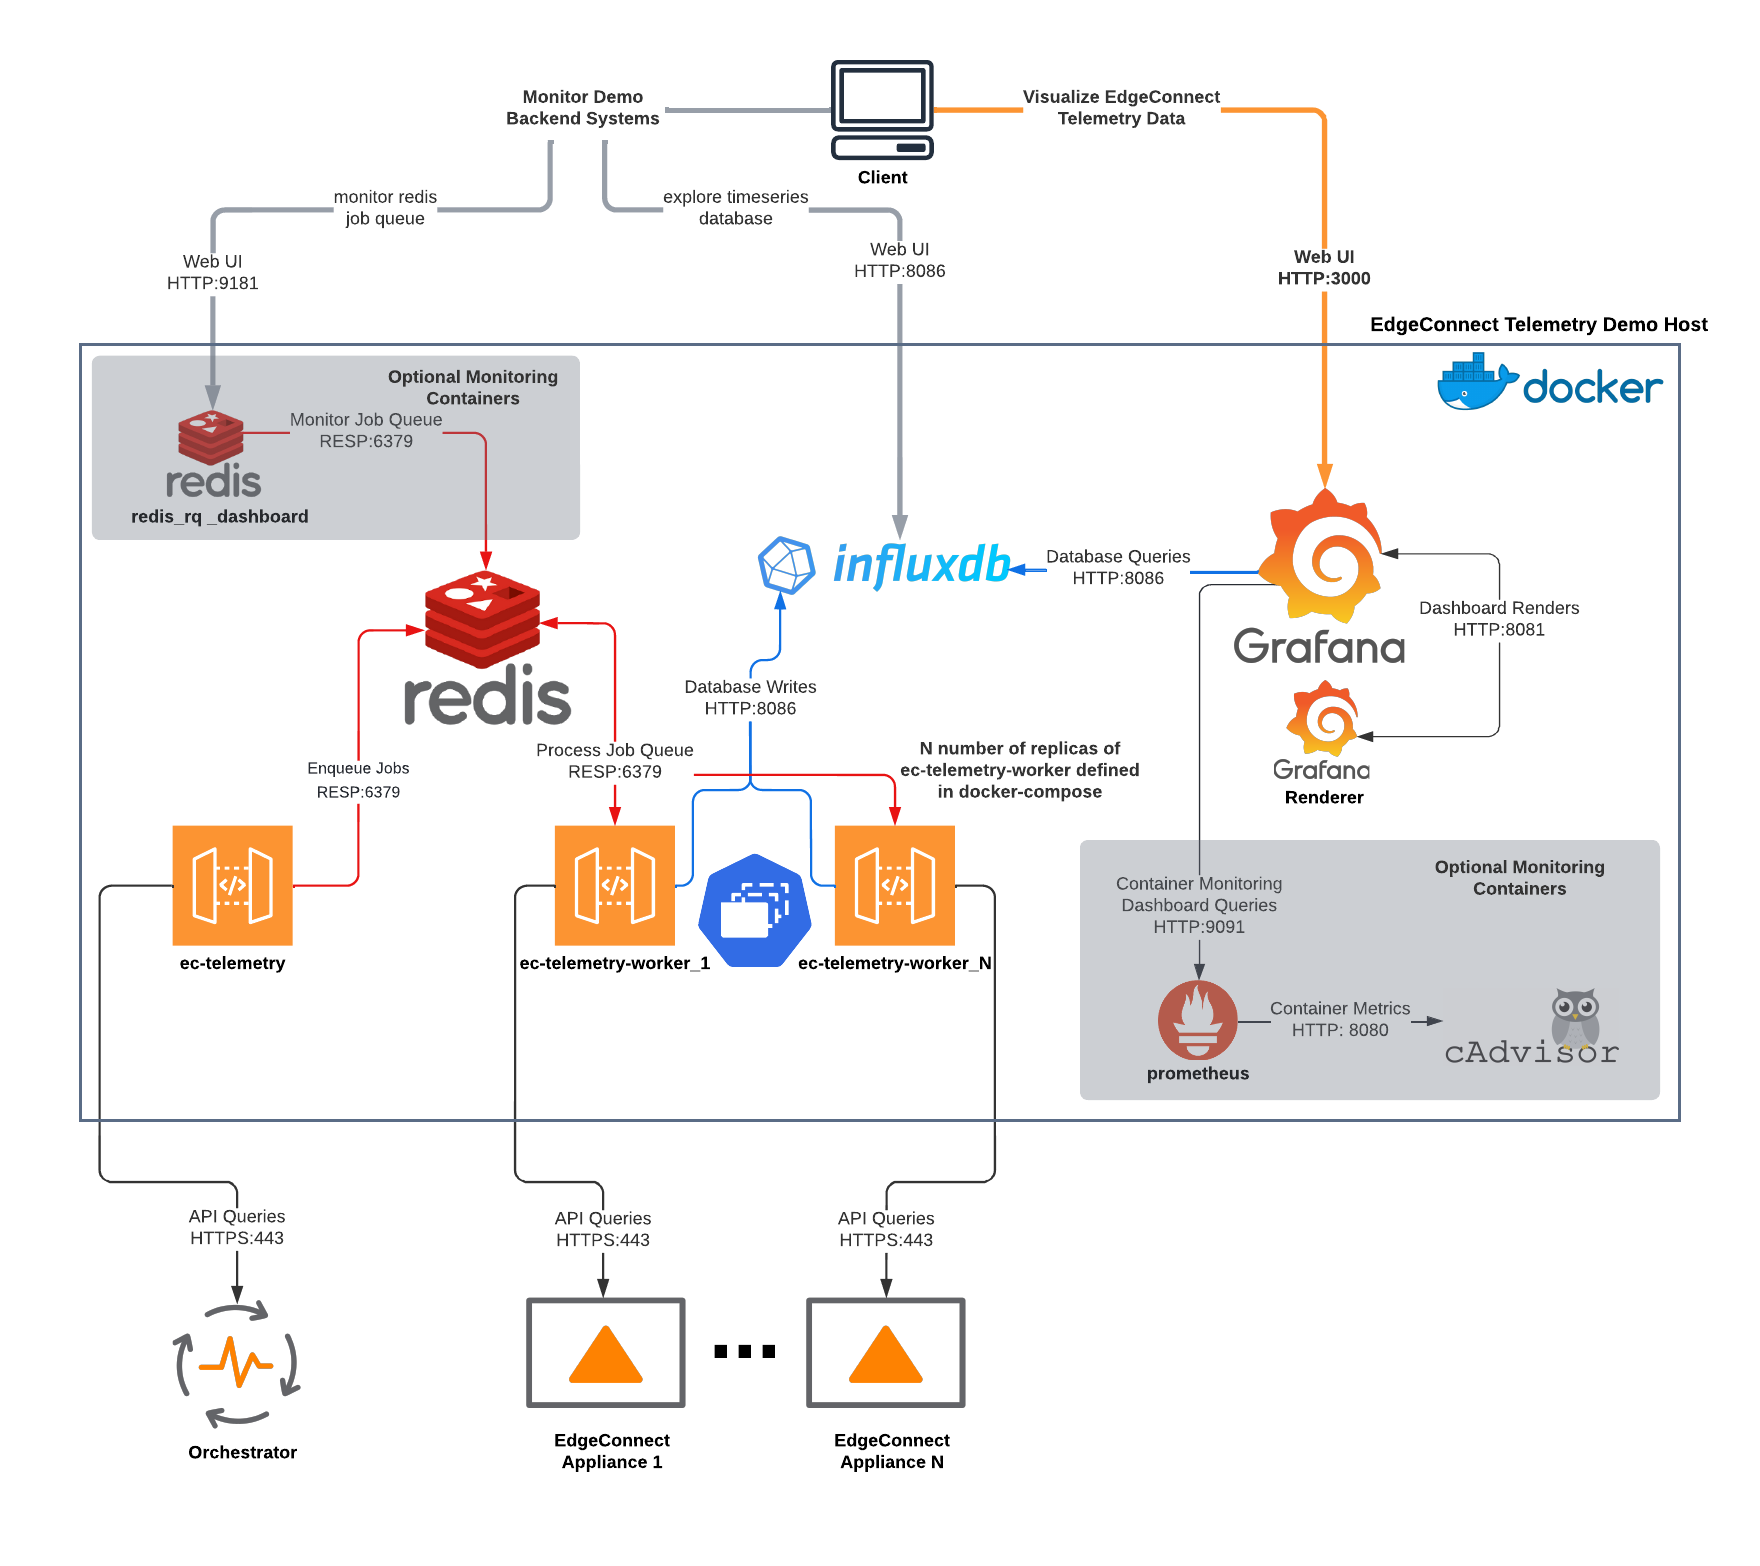
Architecture Overview
Demo Application Architecture
Demo Directory Structure
├── app
│   ├── ec-telemetry
│   │   ├── ec_discover.py
│   │   ├── ec_telemetry.py
│   │   ├── limit_appliances.json
│   │   └── requirements.txt
│   ├── grafana
│   │   ├── dashboards
│   │   │   ├── boost_utilization.json
│   │   │   ├── demo_monitor.json
│   │   │   ├── ec_appliance.json
│   │   │   └── wan_utilization.json
│   │   └── provisioning
│   │       ├── dashboards
│   │       │   └── dashboard_provider.yml
│   │       └── datasources
│   │           └── datasources.yml
│   ├── grafana_render
│   │   └── config.json
│   └── prometheus
│       └── prometheus.yml
├── demo_cleanup.sh
├── docker-compose.monitor.yml
├── docker-compose.yml
├── Dockerfile
└── example.env
System & Environment Requirements
Orchestrator & EdgeConnect
Due to many of the statistics collection data retrieval and formats, the demo requires Orchestrator and EdgeConnect to be on 9.1 releases. The data model for collecting bandwidth licensing levels is written for the current tiered bandwidth model, appropriate numeric values will not be displayed for legacy Base & Plus licenses.
Orchestrator |
EdgeConnect ECOS |
|---|---|
9.1.3+ |
9.1.1.3+ |
Note
The API endpoint for collecting CPU metrics from an appliance requires
read/write access to the appliance. As such the specified user for
the containers to login to the EdgeConnect appliances needs to have
and admin role rather than monitor.
Demo Host & Docker
The system running the demo must have Docker Engine and Docker Compose installed. The demo was tested using Docker Engine 20.10.17 and Docker Compose 1.29.2.
This host system must have IP reachability to Orchestrator and EdgeConnect appliances. The ec-telemetry-worker containers will attempt to connect to the EdgeConnect management addresses as known by Orchestrator.
See below links for installing Docker Engine and Docker Compose:
Installing Docker Engine: https://docs.docker.com/engine/install/
Installing Docker Compose: https://docs.docker.com/compose/install/
There are many guides online for installing Docker & Docker Compose on different systems both from Docker directly as well as different providers, blogs, etc.
CPU & Memory
The cpu and memory utilized by the demo will vary based on scale. The InfluxDB container will use the most as it’s memory-intensive and will grow further based on volume of data stored and queries being performed against it.
The other scale factor is the number of ec-telemetry-worker containers chosen to be deployed. Each will consume 25-100MB of memory. The worker containers have resource limits of 0.50 CPU and 300M Memory per replica in the Docker Compose file included and can be modified if necessary. Note that overly constraining cpu or memory to the worker nodes will impact the telemetry collection.
In the included example.env file, the InfluxDB bucket data retention for the
demo is set to 3 days (3d). This can easily be altered the user’s
preference to store data for longer or shorter periods following syntax
of h for hours, d for days, w for weeks, etc.
Data Granularity & Accuracy
While the minute stats data are stored on an appliance for approximately 24 hours, other metrics included in this demo are gathered at the point in time when the appliance is collected. While the discovery container runs every minute to queue appliances to the ec-telemetry-worker containers, there is no guarantee that the worker containers will complete the task queue before the next round by the discovery container.
Factors contributing to completing the appliance queue within a minute include, but are not limited to, latency to reach appliances, the number of deployed ec-telemetry-worker containers to work on the queue, and overall host system resources where this demo is deployed determining the maximum number of ec-telemetry-worker containers.
Note
Data manipulated in the dashboard queries included in this demo (bytes to bits, bits to megabits, summing or multiplying values, etc.) is best effort, but Orchestrator should be consulted as an authoritative source.
Resource Utilization Examples
OS |
CPU |
Memory |
|
|---|---|---|---|
On-Prem VM |
Ubuntu 20.04 |
2 vCPU |
4GiB |
Equivalent cloud instances would be an AWS t2.medium or Azure Standard_B2s.
All below system utilization stats are based on monitoring of on-premise Unbuntu VM and are not guaranteed performance metrics. Please note that the larger the dataset and/or time window being queried will impact performance as these are per-minute statistics.
For example, a single statistic for one appliance in a 3-day window would be returning 4,320 datapoints.
16 workers / 16 appliances* |
4 workers / 6 appliances |
|
|---|---|---|
CPU |
20-25%, ~500-600GHz |
10-13%, |
System Memory |
3GB |
2GB |
Container Memory |
~1-2.5GB |
~1-1.6GB |
Disk I/O |
Max ~7-8MB/s, average ~0.3MB/s |
tbd |
Docker Images |
~2.4GB |
~2.4GB |
Docker Volumes |
~1G with 3d of data** |
~800M with 3d of data** |
Total Disk Utilization (incl OS) |
~30GB |
~30GB |
* ~1,000 total tunnels being captured in this demo environment
** 3d is default value in example.env file for bucket retention on
Influx and the value for Prometheus data retention in
docker-compose.monitor.yml
Note
The above estimates include ~7% of cpu and ~400M of memory being used by
cAdvisor and Prometheus monitoring the stack itself. These containers
are optional for monitoring the container performance and only
deployed with the additional docker-compose.monitor.yml file.
Utilization can greatly vary by use, higher interaction with the Grafana dashboards, increasing refresh rate, leads to higher queries and increase utilization for Grafana and InfluxDB containers.
Containers & Versioning
Container |
Base Image |
Host-mapped Ports |
Intra-Container Ports |
|---|---|---|---|
ec-telemetry |
Ubuntu 20.04 ** |
– |
– |
redis |
4.0.6-alpine |
– |
6379 |
ec-telemetry-worker * |
Ubuntu 20.04 ** |
– |
– |
influxdb |
2.4.0 |
8086 |
8086 |
grafana |
9.0.4 |
3000 |
3000 |
grafana-renderer |
3.6.1 |
– |
8081 |
Container |
Base Image |
Host-mapped Ports |
Intra-Container Ports |
|---|---|---|---|
redis_q_dashboard |
Ubuntu 20.04 ** |
9181 |
9181 |
cadvisor |
cadvisor |
8080 |
8080 |
prometheus |
prometheus |
9090 |
9090 |
Note
All containers in docker-compose.yml and
docker-compose.monitor.yml are configured for restart
unless-stopped
* Replica instances of ec-telemetry-worker container determined by
environment variable $WORKER_COUNT. All other containers are
single instance.
** All Ubuntu images are built from the Dockerfile in the root
directory of the demo folder. In addition to the base image,
iputils-ping, dnsutils, Python3, pip, and the
following additional Python packages installed (as documented in
app/ec-telemetry/requirements.txt):
pyedgeconnect
influxdb_client == 1.30.0
click >=7,<8
Redis == 4.3.4
rq == 1.11.0
rq-dashboard== 0.6.1
Collection Process Logic
Discover Appliances from Orchestrator & Queue Collection
ec_discover.pyruns on the ec-telemetry container, and first checks if InfluxDB and Orchestrator are reachable (if not retries every 3 seconds)If reachable, proceeds to connect to Orchestrator and retrieves list of appliances with
pyedgeconnect.Orchestrator.get_appliances()Performs additional API calls to Orchestrator for interface label mapping, overlay configuration, and appliance licensing status/values
Checks
limit_appliances.jsonfile to limit telemetry collection to specified hostnamesThe output from the additional API calls to Orchestrator is added to each appliance item in the appliance list
Each appliance in the appliance object in the appliance list is enqueued as a job to the Redis Queue
The process will repeat again in 60 seconds
Collect Data from EdgeConnect Appliances & Write to Database
Note
All tasks below are performed on an instance of the ec-telemetry-worker container for each appliance item they take from the Redis Queue
Write appliance metadata and reachability status to InfluxDB
Check if appliance management IP is reachable via ping (a response code of
0is successful,256indicates unreachable)If ping succeeds, login to the appliance with
pyedgeconnect.EdgeConnect.login()If login succeeds, begin telemetry collection with the following API calls:
On completion or tasks or if exceptions occur in communicating with appliance, the worker will log out of appliance via
pyedgeconnect.EdgeConnect.logout()All the data gathered from the appliance is written to the respective measurements in the InfluxDB database
Visualize Data in Grafana
The Grafana container comes pre-populated with multiple dashboards to visualize the data collected. The JSON for the dashboards is in the
app/grafana/dashboardsdirectoryThe dashboards perform Flux queries to InfluxDB datasource to visualize the appliance data
For more information on working with the InfluxDB Flux query language visit https://docs.influxdata.com/flux/
Required Configuration To Run Demo
Environment Variables
Warning
If fully populated, the .env file could contain sensitive token
information. To refrain from commiting token values to the local
file, system environment values will take precedence over those
referenced in the .env file. This host system can be setup with
environment variables for ORCH_API_KEY, EC_PW, DB_TOKEN,
and DB_PW, or any of the other environment variables referenced
below for the containers without including them in the included
.env file.
Docker-compose will automatically export variables in file named
.env. Existing environment variables of the host system will always
take precedence. Reference values included in example.env file as
shown below.
Docker-compose can use an alternate file with the
--env-file option e.g., $ docker-compose --env-file example.env
up -d
# It is recommended to not store sensitive auth/token information
# in a static file, the below values are only present to document
# the envrionment variable keys the containers will reference.
# Environment variables on the host itself will take precedence
# over any included here

# Orch and EdgeConnect Connection Details
ORCH_URL=<orchestrator_ip_or_fqdn>
ORCH_API_KEY=<orch_api_key>
EC_USER=<ec_username>
EC_PW=<edgeconnect_password>
# Token for Grafana/InfluxDB Communication
# DB_USER and DB_PW used to login to both Grafana/InfluxDB
DB_TOKEN=<database_token>
DB_USER=admin
DB_PW=<database_password>

# Number of replica containers for ec-telemetry-worker
WORKER_COUNT=4

# OPTIONAL SETTINGS, KEEP DEFAULTS IF UNSURE

# Project name and local logging settings
COMPOSE_PROJECT_NAME=EC-Telemetry
LOG_LEVEL=WARNING
LOG_MAX_BYTES=1000000
LOG_MAX_BACKUPS=5
# Timeout to check reachability to EdgeConnect
EC_TIMEOUT=2
# Database Connection Details
DB_ORG=ECTELEM
DB_URL=http://influxdb:8086
DB_BUCKET=ECTELEM
DB_RETENTION=3d
# OPTIONAL CUSTOM DNS SERVER FOR CONTAINERS
# To use, un-comment the `dns:` option for containers in docker-compose.yml
# DNS_SERVER=8.8.8.8
Note
The API endpoint for collecting CPU metrics from an appliance
requires read/write access to the appliance. As such the specified
user for the containers to login to the EdgeConnect appliances needs
to have and admin role rather than monitor
Limit Appliances JSON File
By default, the telemetry script will gather data from the first four
reachable appliances returned by
pyedgeconnect.Orchestrator.get_appliances() and write the
hostnames to the file limit_appliances.json (located in
app/ec-telemetry/limit_appliances.json).
To specify which appliances to collect telemetry for in advance,
add the hostnames to the list appliance_subset in the
limit_appliances.json file.
Default contents of limit_appliances.json file:
{
    "appliance_subset": [],
    "example": [
        "Hostname-01",
        "SITE-HQ-02",
        "MyAppliance-A"
    ],
    "comment": "List of appliance hostnames to limit telemetry collection to"
}
Example contents below where the telemetry would only be collected
from two appliances REAL-HOSTNAME-01 and REAL-HOSTNAME-02 as
shown under the appliance_subset key:
{
    "appliance_subset": [
      "REAL-HOSTNAME-01",
      "REAL-HOSTNAME-02"
    ],
    "example": [
        "Hostname-01",
        "SITE-HQ-02",
        "MyAppliance-A"
    ],
    "comment": "List of appliance hostnames to limit telemetry collection to"
}
The ec-telemetry` directory is copied to the containers on build and
not a mounted volume. If you wish to edit the limit_appliances.json
file for collecting telemetry of different appliances, either modify the
copy within the ec-telemetry-discover container or modify the local
file and rebuild the containers with the --build option.
Logging & Monitoring
The python scripts for the ec-telemetry and ec-telemetry-worker
containers will write to a centralized local log file located at
app/logging/ec-telemetry.log on the host running the demo.
Check this file when running the demo to see the containers are properly reaching Orchestrator, InfluxDB, and the EdgeConnect appliances.
The message levels and max file size will be determined by the
environment variables outlined in the Environment Variables section.
These default to logging evel of ERROR, max file size of 1MB,
and rotating maximum of 5 log files as documented in the .env
file.
LOG_LEVEL=ERROR
LOG_MAX_BYTES=1000000
LOG_MAX_BACKUPS=5
This will capture errors in the telemetry collection from Orchestrator and target appliances.
example log message below for two appliances, EC-01 and
EC-02:
2022-09-12 22:03:33,033 - ERROR - cid: de11e3d0706e - EC-01 @ 10.41.2.125 - 2.8259: FAILED TO LOGIN
2022-09-12 22:03:34,271 - ERROR - cid: 1aa54222ea6b - EC-02 @ 10.41.0.70 - 4.0705: FAILED TO PING APPLIANCE -- ping response code: 256
The structure of the log messages are as follows:
<date & time> - <log severity> - cid: <container id> -
<EdgeConnect Hostname> @ <EdgeConnect IP> -
<process timer>: <log message>
Monitoring the container performance/utilization can be performed with
the additional docker-compose.monitor.yml file as noted below which
will launch cAdvisor, Prometheus, and the data will be visualized in
an included dashboard in the Grafana instance.
In docker-compose.monitor.yml the included option for Prometheus
data retention period is set to 3 days as seen in
--storage.tsdb.retention=3d.
Run the demo
Once you’ve filled out the required details in your .env file or
configured respective environment variables on the host system to
point the demo towards an Orchestrator and EdgeConnect appliances,
the following commands will start the demo infrastructure and begin
telemetry collection.
$ docker-compose up -d
Note
If the user is not part of the docker group and you have to run
the docker commands with sudo, host environment variables will not
be passed to the sub-process. To pass them you must add the -E flag
to sudo, e.g., $ sudo -E docker-compose up -d
Both methods can still be combined of host environment variables
and a environment variables file as follows:
$ sudo -E docker-compose --env-file example.env up -d
Where overlapping host environment variables take precedence with
those in the example.env file.
If you make changes to the scripts or files in in the app/ec-telemetry
directory (e.g. limit_appliances.json) you’ll want to have the
containers rebuilt with the --build option.
$ docker-compose up -d --build
There is an optional compose file including cAdvisor and Prometheus to monitor the resource utilization of the containers themselves. A dashboard is also included in the grafana container to visualize this data. To run the additional containers you can use the following syntax to specify multiple compose files
$ docker-compose -f docker-compose.yml -f docker-compose.monitor.yml up -d
To stop all containers
$ docker-compose stop
To stop all telemetry collection workers but keep other containers running to continue to explore collected data
$ docker container stop $(docker container ls -q --filter name="ec-telemetry*")
To stop all containers and clean up volumes use the included
demo_cleanup.sh script
$ bash demo_cleanup.sh
Telemetry Documentation and Dashboards
Stats Collected / Processed in this Demo
Orchestrator to Appliance state/reachability over time
Minute Stats Telemetry
tunnel stats
flow stats
boost stats
interface stats
drops stats (filtered for certain drop types)
interface overlay stats
Current memory use
Current CPU use (returns 5sec intervals for whole minute)
Current route table size
Number of active tunnels by type (underlay, overlay, third party)
Number of total down tunnels (max of 1000 logged per type)
Retrieve deployment - get configured WAN BW on interfaces
Static info – HW Model, SW Ver, License, System BW
Alarm counts by type (Critical, Major, etc.)
Disk utilization
System info to retrieve appliance uptime
Realtime stats to calculate realtime packets per second at the time of collection
Important
Alarms are collected directly from appliance, so if alarms have been modified or disabled in Orchestrator that will not be reflected in the data on this dashboard. E.g. Tunnel software version mis-match is disabled in Orchestrator, but the appliance locally has 4 minor alarms for tunnel software version mis-match, the dashboard will show 4 minor alarms while Orchestrator will show 0.
Note
There are additional additional Minute stats files downloaded from the
pyedgeconnect.EdgeConnect.get_appliance_stats_minute_file() API
endpoint, and more continue to be added. While this demo does not use
that data, more detail about the returned data for this function is
available on DevHub
https://developer.arubanetworks.com/edgeconnect/docs/examples
Dashboards
When navigating the included dashboards, most panels have an info description in the upper left corner with additional description details of the panel. Click the (i) for description of the data being presented.
EdgeConnect Telemetry
Review many detailed metrics and statistics for a single appliance.
There are many sections of data on this dashboard, including overall System stats, WAN and LAN utilization analysis, data over overlays, tunnel counts and distribution, overlay tunnel pre & post FEC & POC, as well as a dashboard variable to look at details for a specific tunnel from the selected appliance.
Variable |
Chained to |
Description |
|---|---|---|
|
– |
Lists discovered buckets in InfluxDB |
|
|
Choose appliance to populate dashboard data |
|
|
Visualize tunnel details in |
|
|
Repeats WAN label graphs
|
|
|
Repeats LAN interface graphs
|
* These dashboard variables are hidden as they are meant to be left
to the All value
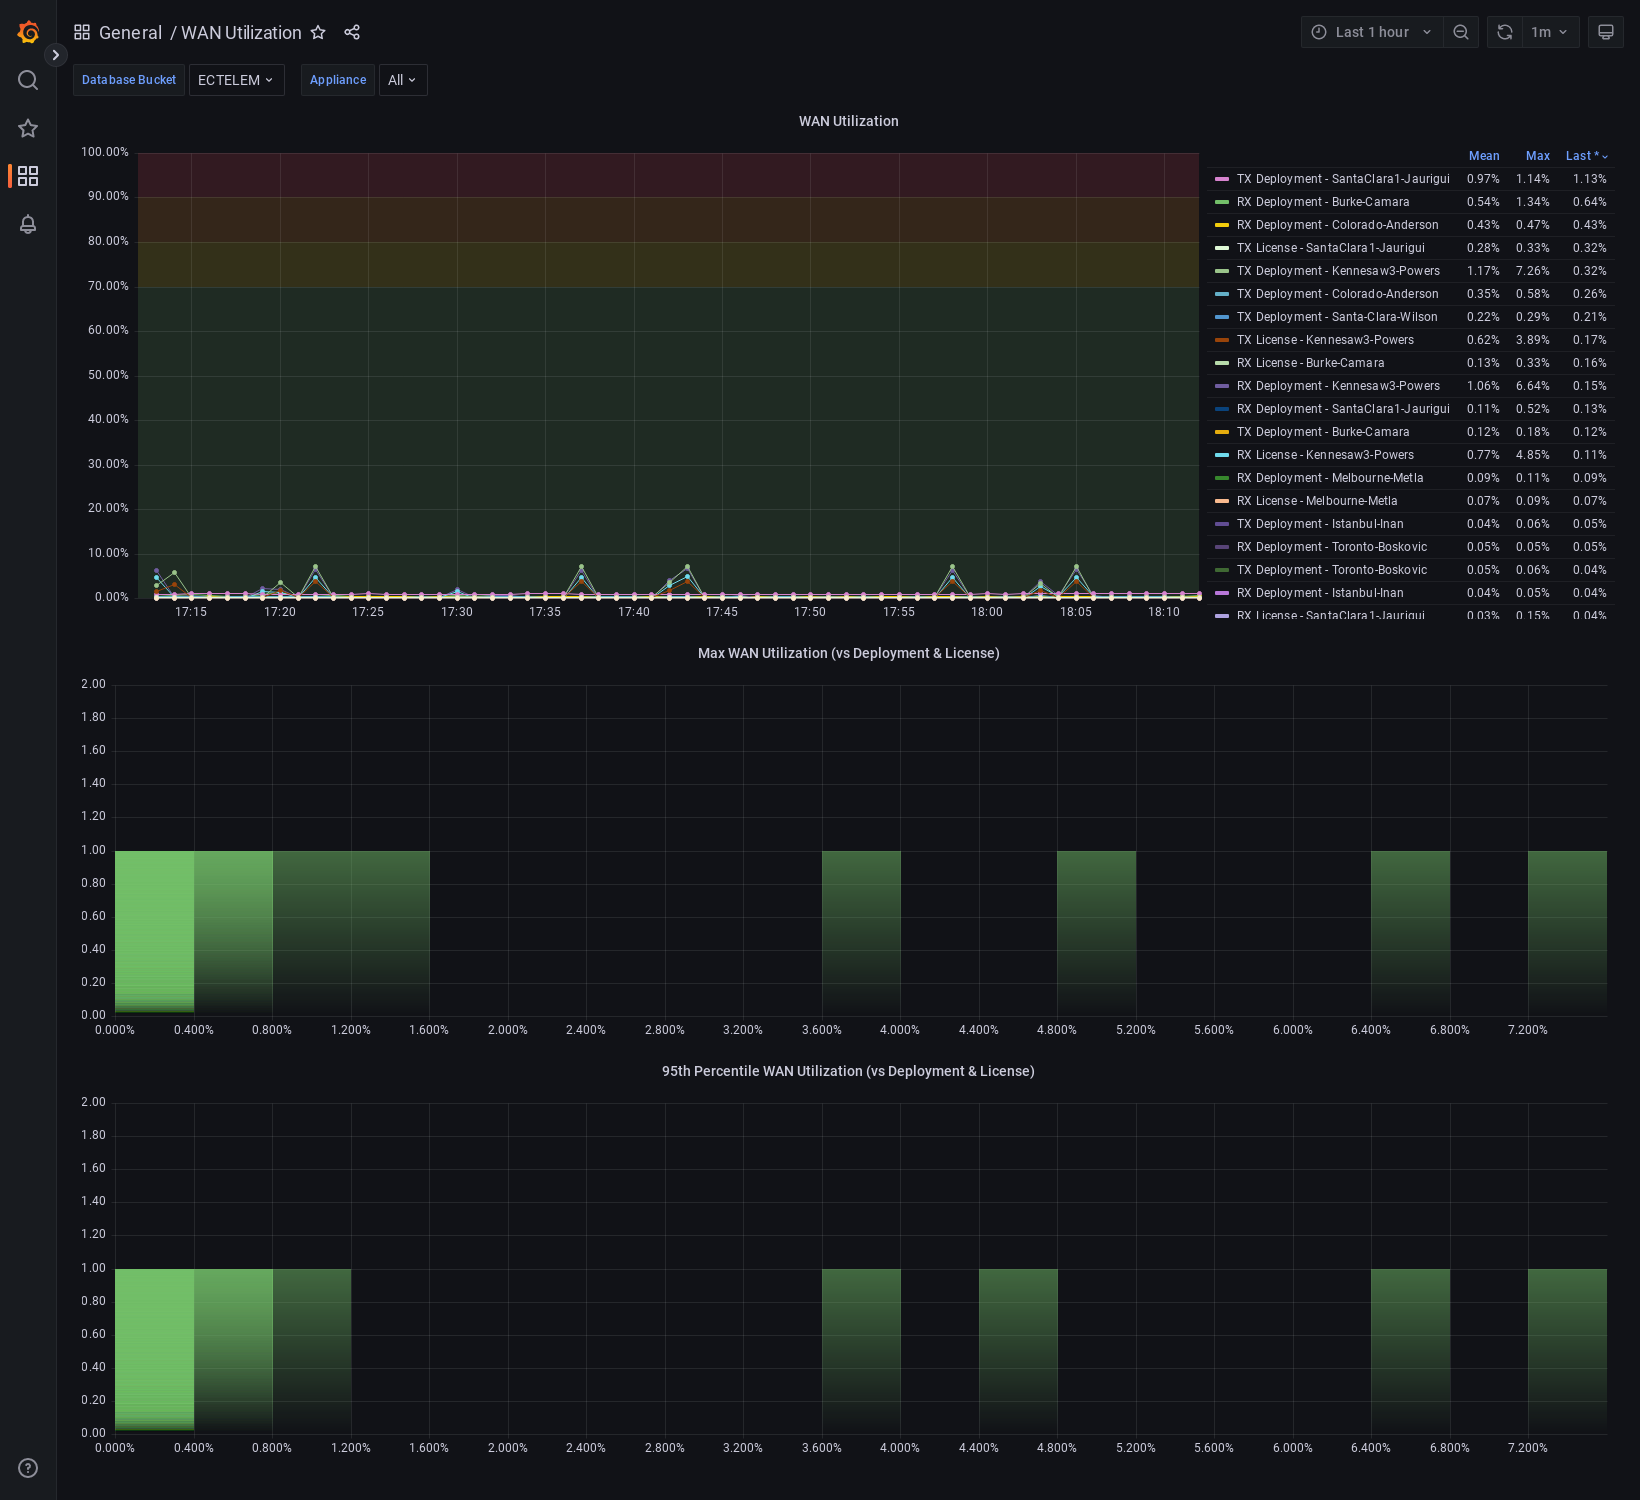
System WAN BW For All Appliances
System BW utilization graph for all appliances compared to deployment values & license levels. This does not currently support legacy Base & Plus licensing. Appliances with Unlimited licenses will not have a utilization % calculated against the license, but all appliances will calculate utilization % against the deployment system values.
This can help identify outliers of appliances that are running at high utilization against their configured bandwidths or licenses.
The two lower histograms help identify where a majority of appliances are transmiting as a max value within the speicifed time window as well as their 95th percentile distribution in the same period.
Variable |
Chained to |
Description |
|---|---|---|
|
– |
Lists discovered buckets in InfluxDB |
|
|
Leave |
Boost Utilization for All Appliances
Cumulative Boost utilization for all appliances. One heatmap to show a normalized view of % utilization of Boost used vs. amount configured, as well as a heatmap of absolute values seeing which appliances are using the most.
Notably the pie chart shows the cumulative utilization of boost for all appliances in the time period, while the time series graph is able to quickly pinpoint an outling appliances that experienced insufficient Boost in the time period.
Variable |
Chained to |
Description |
|---|---|---|
|
– |
Lists discovered buckets in InfluxDB |
|
|
Leave |
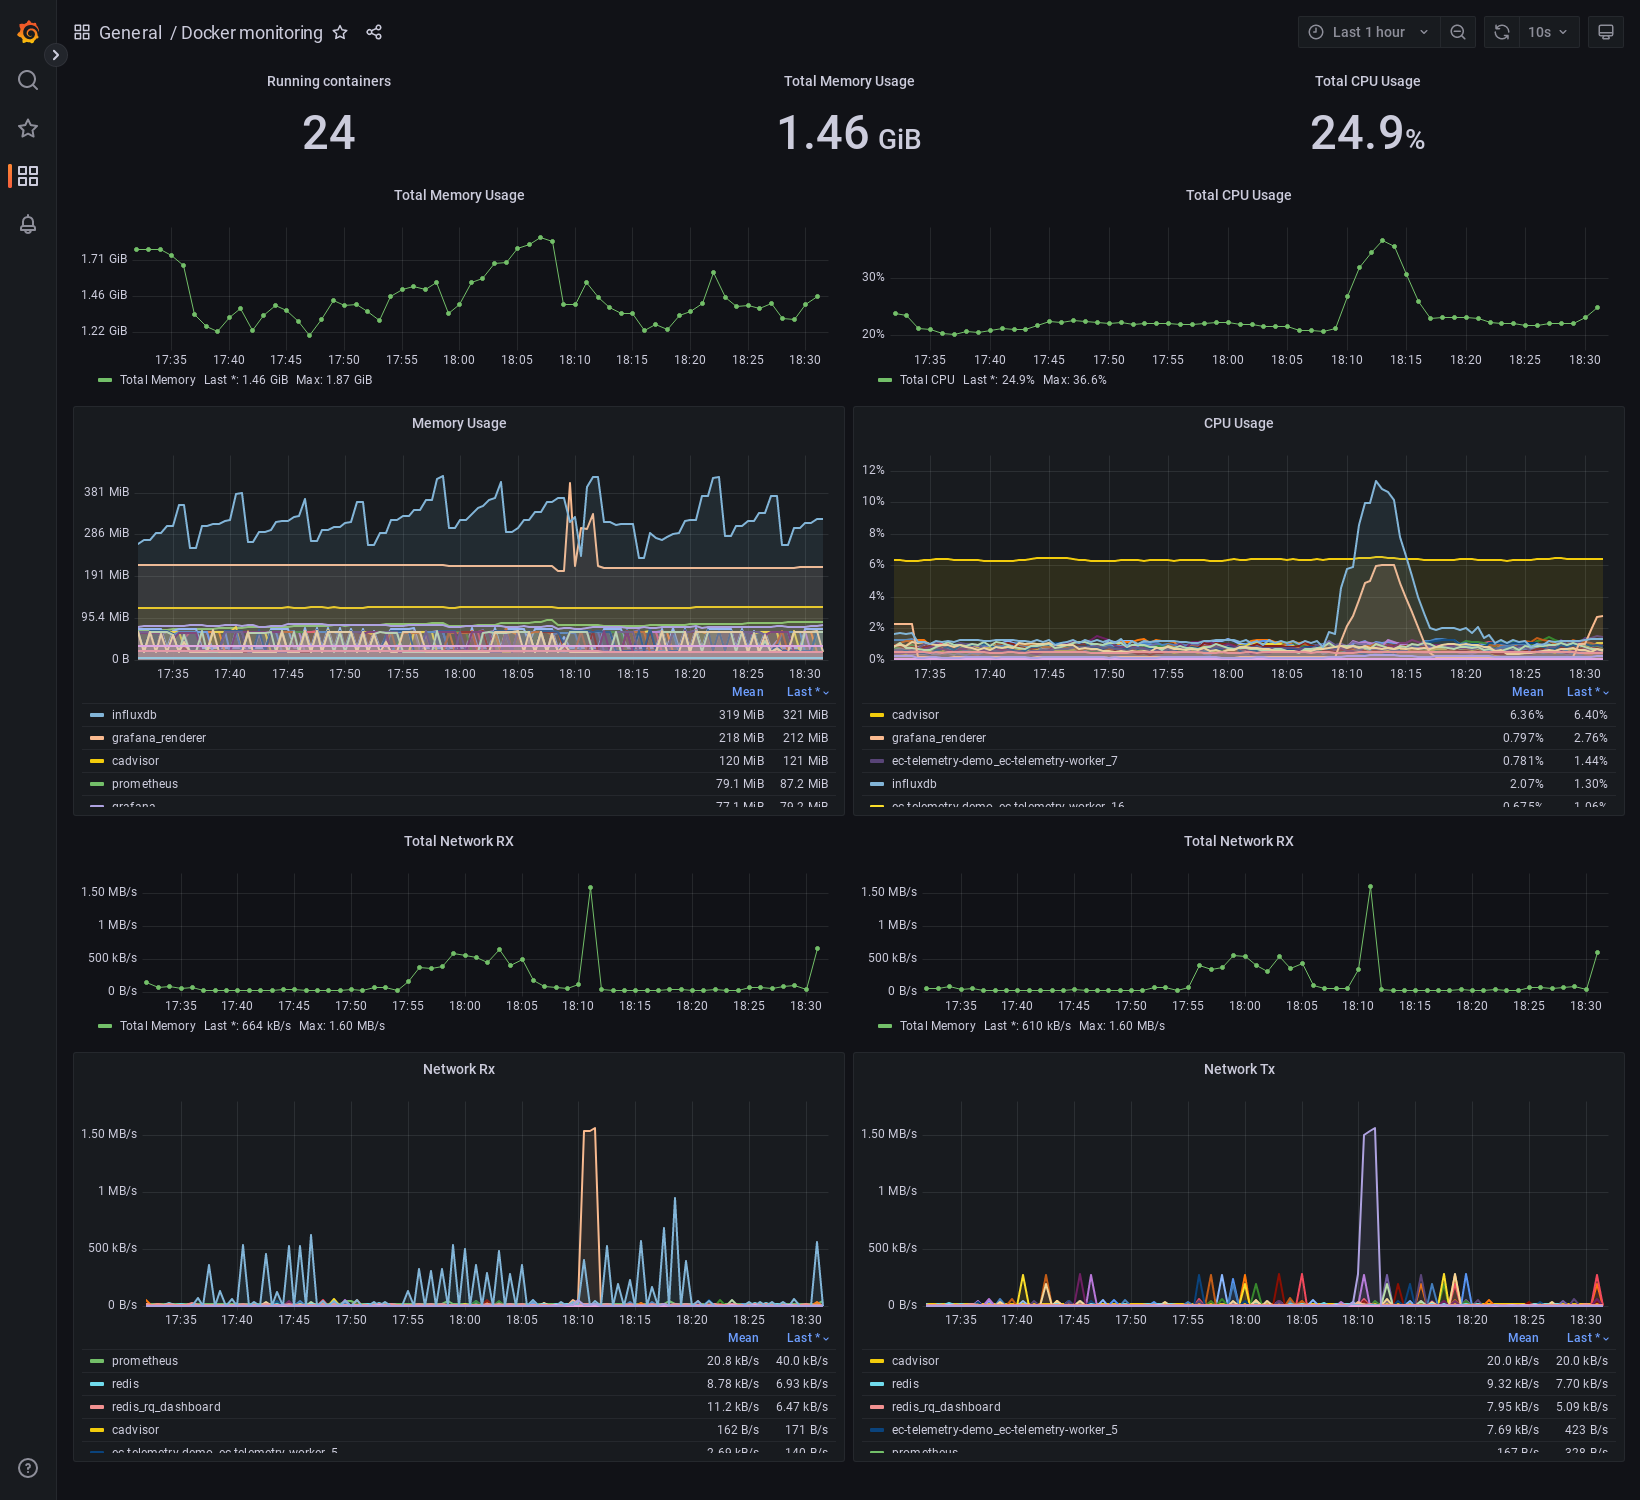
Docker Monitoring
Monitor resource utilization of docker containers for demo including total and per-container view of memory, cpu, and network activity
How To Render/Export Dashboard Screenshots
With dashboards sometimes including large amounts of panels that would not fit on a screen, capturing screenshots of example data is difficult. The grafana-renderer container is included to help render an image of a full dashboard or panel.
Render a dashboard or panel to a PNG image from cURL:
1. Create a API key or Service Account with token on Grafana (viewer permissions suffice)
2. Use the following syntax in a cURL command from a system that can reach the grafana interface
$ curl "http://${DOCKER_HOST}:3000/render/d/${DASHBOARD_UID}/${DASHBOARD_NAME}?orgId=1&var-db_bucket=ECTELEM&var-ec_hostname=${APPLIANCE_HOSTNAME}&var-tunnel_analysis_peer=${PEER_TUNNEL_NAME}&var-wan_labels=All&var-lan_interfaces=All&from=now-1h&to=now&width=1640&height=5400" -H "Authorization: Bearer ${GRAFANA_API_TOKEN}" --compressed > ${FILENAME}
Example with values filled in
$ curl "http://my.docker.lab:3000/render/d/ec-appliance/edgeconnect-telemetry?orgId=1&var-db_bucket=ECTELEM&var-ec_hostname=SantaClara1-Jaurigui&var-tunnel_analysis_peer=to_WEST2-AWS_RECREATIONAL&var-wan_labels=All&var-lan_interfaces=All&from=now-1h&to=now&width=1640&height=5400" -H 'Authorization: Bearer abc123456789' --compressed > EC_DASHBOARD.png
The rendered dashboard will be downloaded
Render a dashboard or panel to a PNG image from the GUI:
Replacing appropriate values of the Grafana URL, dashboard ID and name, along with any required dashboard variables, use the following syntax in the browser to navigate to
http://${DOCKER_HOST}:3000/render/d/${DASHBOARD_UID}/${DASHBOARD_NAME}?orgId=1&var-db_bucket=ECTELEM&var-ec_hostname=${APPLIANCE_HOSTNAME}&var-tunnel_analysis_peer=${PEER_TUNNEL_NAME}&var-wan_labels=All&var-lan_interfaces=All&from=now-1h&to=now&width=1640&height=5400